
Understanding mobile game analytics can be a bit difficult, but it is a key factor for game developers to succeed in a fiercely competitive market. Analyzing these metrics gives you valuable information about player behavior, game performance, and how the game is profitable.
Metrics are all forms of numbers and data. Some metrics are easy to understand, such as installs and plays, while others, such as user churn and average revenue per paying player (ARPPU). ), may be more difficult to understand. However, each of these metrics is like a puzzle piece that, when put together, paints an overall picture of how players interact with your game.
To make it easier for you to visualize, we have compiled a list of 10 important indicators that you may have heard of but don't fully understand their importance or don't know how to use them effectively.
Daily active users (DAU)
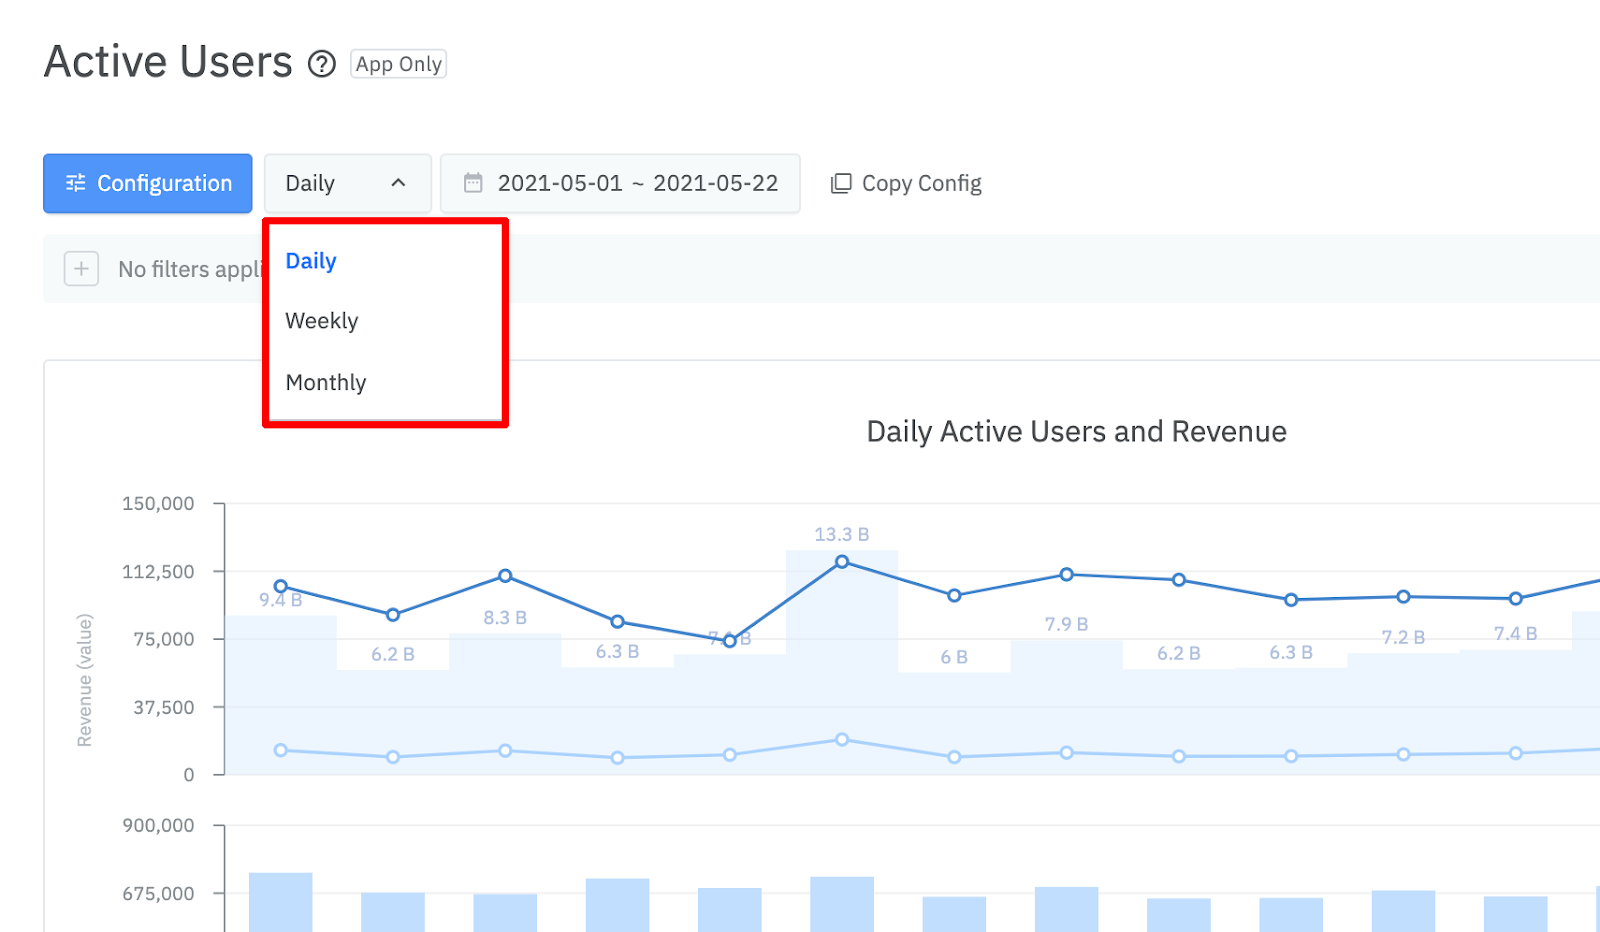
Daily active users (DAU) are the number of unique users who interact with the game in a day. This is a key indicator to measure the game's popularity by day. DAUs provide insights into how often players interact, helping developers gauge user engagement, track trends over time, and identify player behavior patterns .
However, it's important to put DAUs in context. Let's say a game with 10,000 active players, participating multiple times per day and contributing revenue. Compare that to a news or messaging app that has 1,000,000 DAUs but no in-app monetization mechanism. Although the second app attracts more players, the developer has no revenue stream, which may limit further development and improvement of the game. This shows that a DAU is just a snapshot at a specific time, and the surrounding context can be just as important, if not more important, than the large user base.
Sessions: Measure the level of "grinding" the game
Session is each session a user opens your application. Similar to DAU, total Sessions need to be put in context to be a useful metric.
It's important to focus on the average number of Sessions per DAU (DAU/Session). This index indicates the player's level of engagement with the game.
Game genre really affects the Session/DAU ratio, as some games encourage playing multiple short sessions throughout the day. If players come back 5-10 times a day, you can rest assured they like the game.
In addition, you should also pay attention to the session length. This is a metric that measures the average time of a Session, showing how long players usually play each time. Long sessions indicate high levels of game engagement and enjoyment, while short sessions can be a sign of game pacing, insufficient content depth, or player difficulty.
Engagement metrics: Measure the level of "loyalty" to the game
DAU/MAU Ratio (Daily Active Users/Monthly Active Users)
The DAU/MAU (Daily Active Users/Monthly Active Users) ratio is an important indicator of an app's ability to retain players, often referred to as the “stickiness” of the game. This metric tells you how often users log in to the game.
To make it easier to imagine, let's look at an example:
Let's say a game has 100,000 monthly active users (MAU) and an average of 15,000 daily active users (DAU). So the DAU/MAU ratio will be 15%. This means that on average users were logged in about 15% days in that month.
Since this is a ratio, this index can only range from 0 to 1. A value closer to 1 shows that users open the app more often. Popular apps like Facebook have a DAU/MAU ratio of up to 68%, while most successful gaming apps have a ratio closer to 20%.
User retention rate: : The core secret for success
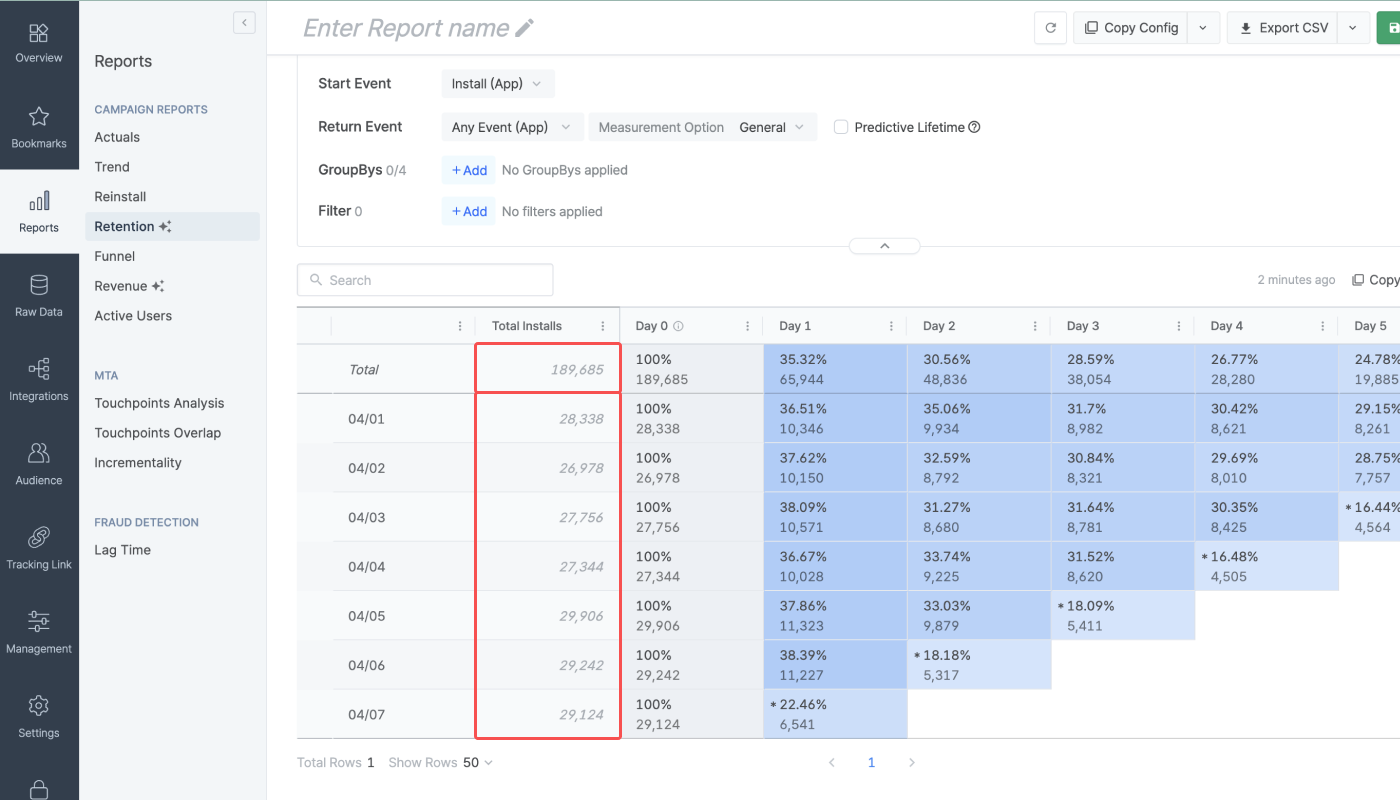
Retention can be considered the most important indicator of a free-to-play game. Successful free games build lasting relationships with players. Players who enjoy the experience will be willing to pay to gain a competitive edge. A game needs to have high retention to have time to build this relationship.
How to calculate Player Retention: We recommend separating players into groups (cohorts) based on the date they downloaded your app. The download date is considered Day 0. Users who open the app the next day (Day 1) are considered retained. On the contrary, if they do not open the app, it is considered non-retention. This calculation is performed for each user group each day after downloading the app. The standard time points used to measure Retention are Day 1, Day 3, Day 7, and Day 30.
Additionally, you can also measure event-based retention or focus on how different triggers affect Retention rates.
Predicting customer lifetime value: A measure of player potential
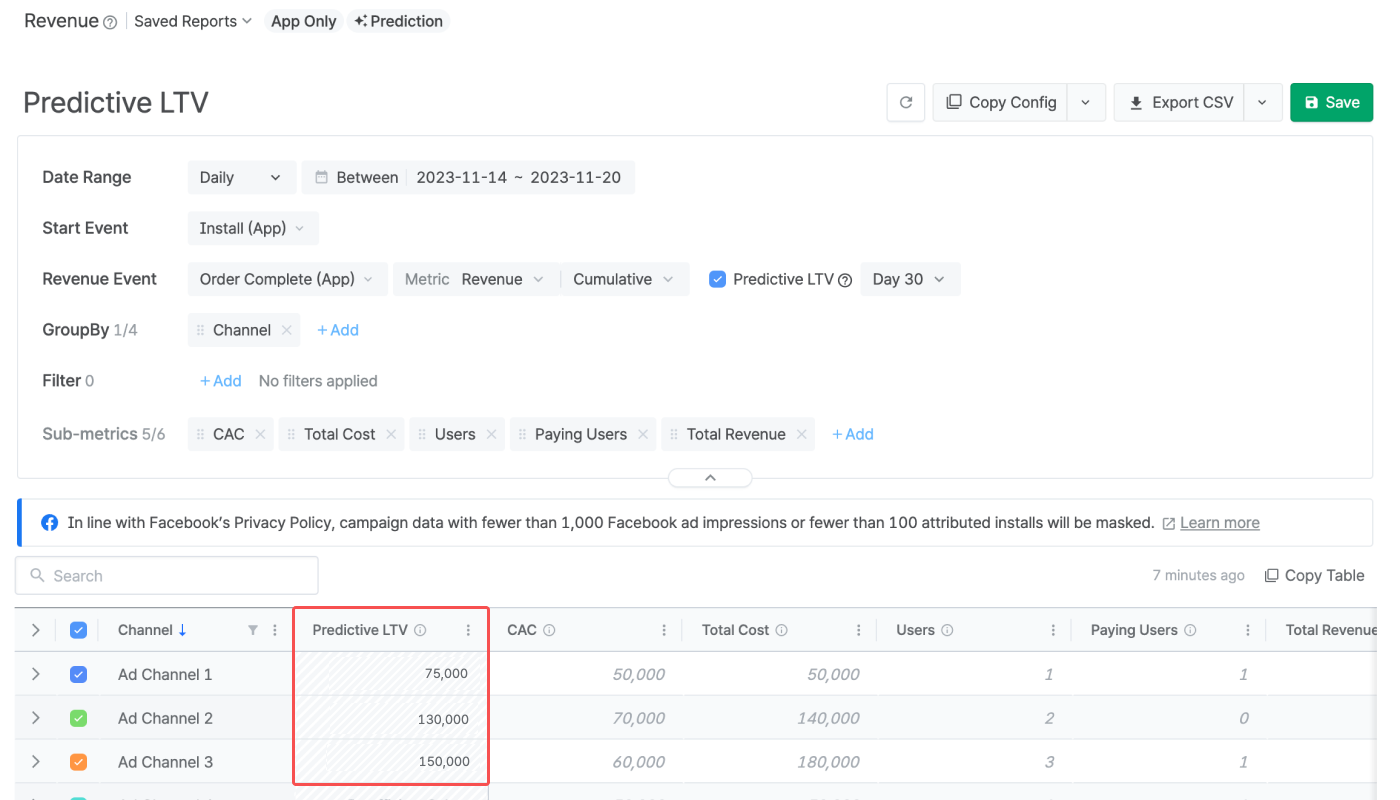
Predicted customer lifetime value (pLTV) is another key metric for game developers to track. This is a future-oriented metric that estimates a player's total revenue potential throughout their gaming journey. pLTV uses advanced predictive analytics techniques to predict players' future spending behavior based on their previous interactions and in-game activity.
By leveraging this metric, game developers can gather valuable information about the long-term revenue potential of their player community, allowing them to adjust their marketing and monetization strategies accordingly. By identifying high-value players early and implementing targeted engagement and retention tactics, developers can maximize the lifetime value of their player communities and drive growth sustainable revenue.
pLTV also allows developers to optimize user acquisition campaigns by identifying the most valuable player segments and allocating resources to attract similarly high-value players. By focusing on attracting players with the highest predicted lifetime value, developers can improve the overall return on investment (ROI) of their user acquisition efforts and drive profitable growth. more profitable.
User churn rate
Churn rate is basically the opposite term to user retention rate. This index indicates the number of players who stop participating in the game in a certain period of time, a sign that players are "quitting the game" or no longer engaged with the game. A high abandonment rate indicates problems with player retention and game satisfaction, while a low abandonment rate indicates high player loyalty and satisfaction.
Monetization metrics: Turning passion into money
Let's move on to everyone's favorite topic: Money! The metrics above measure your relationship with users, how often they return to the game, and their behavior. But arguably the most important metric for many indie developers is whether their game is making enough money.
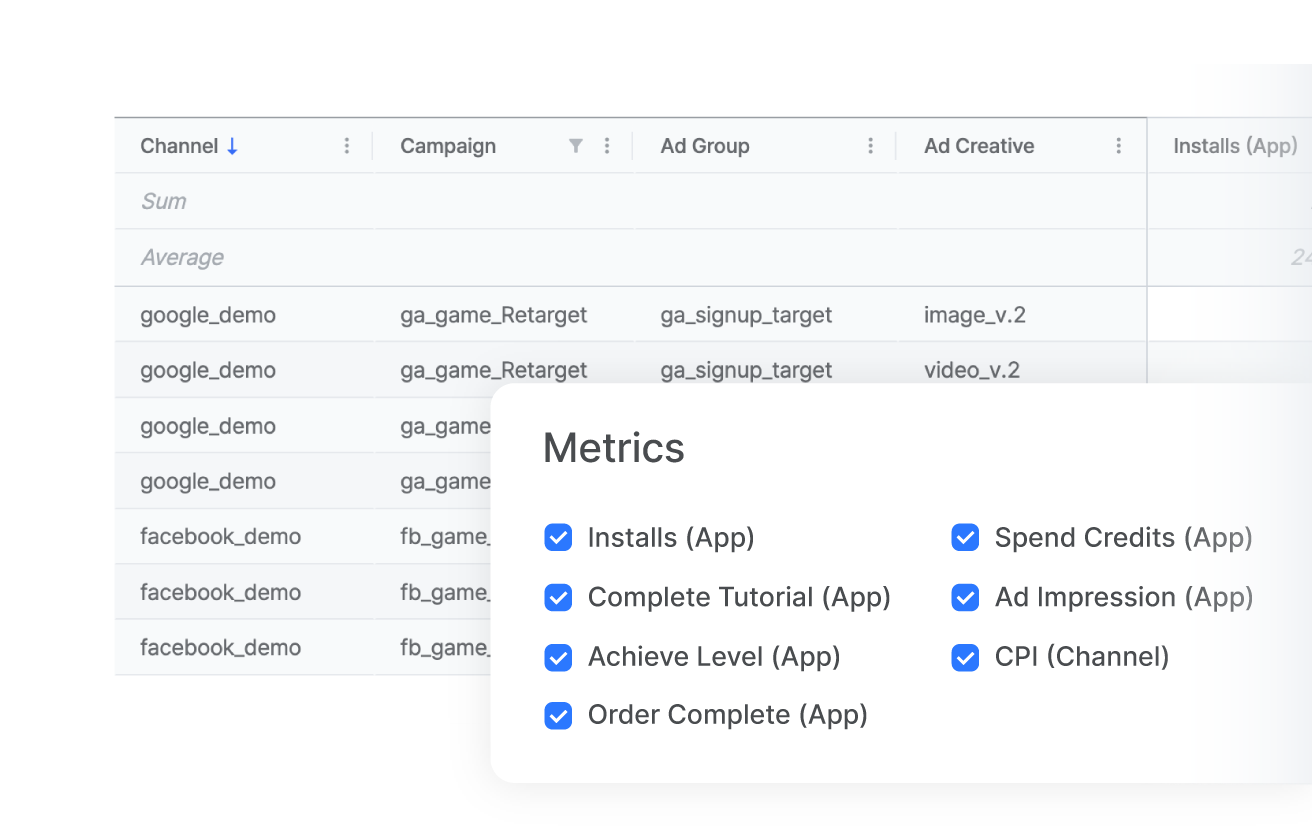
Conversion rate
Conversion rate measures the proportion of unique users who make a purchase out of the total number of users in a given time period. You can also measure the conversion rate of ads displayed in a free game.
Getting players to spend real money on a free game is a challenge. But like many other industries, in free-to-play games, frequent purchasers generate the majority of revenue. You can encourage players to make their first transaction by offering them a virtual item of attractive value.
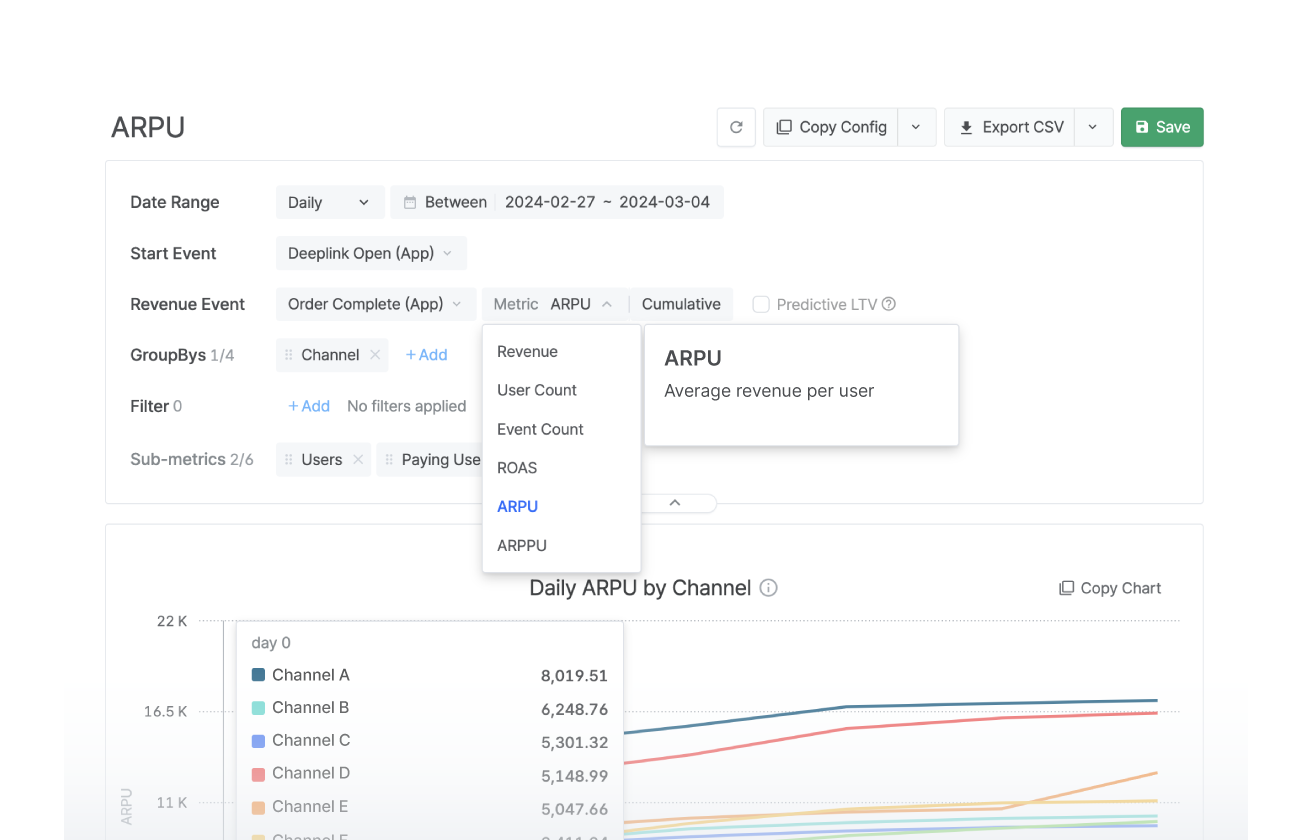
Average revenue per daily active users (ARPDAU): Measures the effectiveness of your monetization strategy
Average revenue per daily active users (ARPDAU) is a monetization metric that measures the average revenue generated by each unique user who interacts with a game or app in a day. It provides insights into the effectiveness of monetization strategies and the overall revenue potential of the user community. By dividing the total daily revenue generated by the number of daily active users, the developer can calculate the average revenue generated per user per day.
ARPDAU helps developers evaluate the performance of in-game monetization features, optimize pricing models, and track revenue trends over time. This is a key metric to maximize revenue and drive sustainable growth for games & apps
ARPDAU is a great metric to track before and during user acquisition campaigns. Before engaging users, make sure you know your ARPDAU range and how it typically fluctuates. During your campaign, group new users by source and see which networks or games perform best in your app.
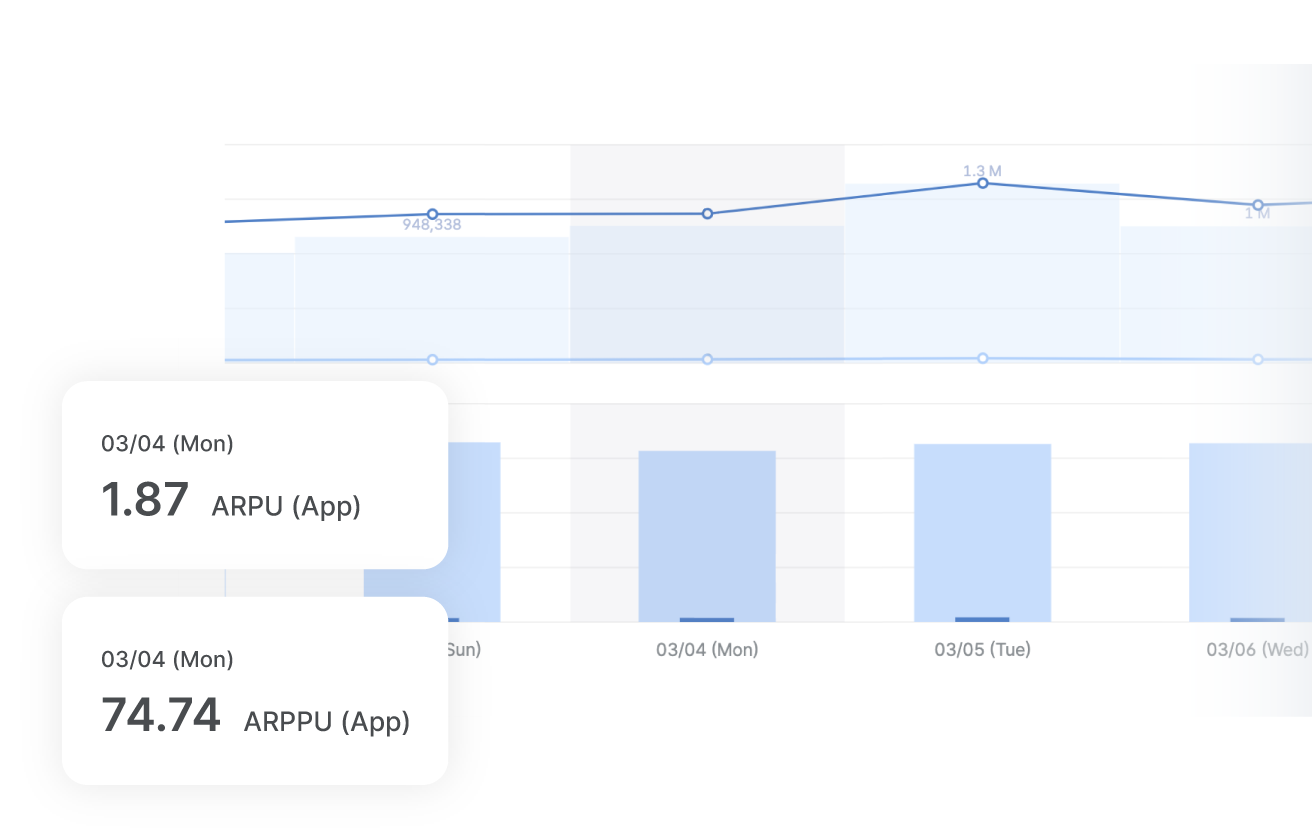
Average revenue per paying player (ARPPU)
Average revenue per paying player (ARPPU) measures only the segment of players who completed an in-game purchase. This indicator can vary significantly depending on the game genre. Hardcore games (for professional players) tend to have higher monetization metrics like ARPPU, but they also don't attract as many mass players as casual games (easy to play).
The above indicators are standards that can help you get started in the world of data analysis. The most important part of mobile game data analysis is getting started and setting benchmarks for your games. When you understand player behavior, you can measure things like the impact of game updates or changes to user acquisition strategies.
If you want data analytics tailored specifically for the gaming industry, visit GameAnalytics and explore their cost-effective analytics solutions. From an easy-to-use analytics platform to industry benchmarks and access to raw data, GameAnalytics lets you optimize your games while keeping your data safe.